Are Home Prices Going Up or Down In Simi Valley, CA? That Depends…
Media coverage about what’s happening with home prices can be confusing. A large part of that is due to the type of data being used and what they’re choosing to draw attention to. For home prices, there are two different methods used to compare home prices over different time periods: year-over-year (Y-O-Y) and month-over-month (M-O-M). Here’s an explanation of each.
Year-over-Year (Y-O-Y):
- This comparison measures the change in home prices from the same month or quarter in the previous year. For example, if you’re comparing Y-O-Y home prices for April 2023, you would compare them to the home prices for April 2022.
- Y-O-Y comparisons focus on changes over a one-year period, providing a more comprehensive view of long-term trends. They are usually useful for evaluating annual growth rates and determining if the market is generally appreciating or depreciating.
Month-over-Month (M-O-M):
- This comparison measures the change in home prices from one month to the next. For instance, if you’re comparing M-O-M home prices for April 2023, you would compare them to the home prices for March 2023.
- Meanwhile, M-O-M comparisons analyze changes within a single month, giving a more immediate snapshot of short-term movements and price fluctuations. They are often used to track immediate shifts in demand and supply, seasonal trends, or the impact of specific events on the housing market.
The key difference between Y-O-Y and M-O-M comparisons lies in the time frame being assessed. Both approaches have their own merits and serve different purposes depending on the specific analysis required.
Why Is This Distinction So Important Right Now?
We’re about to enter a few months when home prices could possibly be lower than they were the same month last year. April, May, and June of 2022 were three of the best months for home prices in the history of the American housing market. Those same months this year might not measure up. That means, the Y-O-Y comparison will probably show values are depreciating. The numbers for April seem to suggest that’s what we’ll see in the months ahead (see graph below):
That’ll generate troubling headlines that say home values are falling. That’ll be accurate on a Y-O-Y basis. And, those headlines will lead many consumers to believe that home values are currently cascading downward.
However, on a closer look at M-O-M home prices, we can see prices have actually been appreciating for the last several months. Those M-O-M numbers more accurately reflect what’s truly happening with home values: after several months of depreciation, it appears we’ve hit bottom and are bouncing back.
Here’s an example of M-O-M home price movements for the last 16 months from the CoreLogic Home Price Insights report (see graph below):
Why Does This Matter to You?
So, if you’re hearing negative headlines about home prices, remember they may not be painting the full picture. For the next few months, we’ll be comparing prices to last year’s record peak, and that may make the Y-O-Y comparison feel more negative. But, if we look at the more immediate, M-O-M trends, we can see home prices are actually on the way back up.
There’s an advantage to buying a home now. You’ll buy at a discount from last year’s price and before prices start to pick up even more momentum. It’s called “buying at the bottom,” and that’s a good thing.
Bottom Line
If you have questions about what’s happening with home prices, or if you’re ready to buy before prices climb higher, let’s connect.
Today’s Real Estate Market: The ‘Unicorns’ Have Galloped Off In Simi Valley, CA
Comparing real estate metrics from one year to another can be challenging in a normal housing market. That’s due to possible variability in the market making the comparison less meaningful or accurate. Unpredictable events can have a significant impact on the circumstances and outcomes being compared.
Comparing this year’s numbers to the two ‘unicorn’ years we just experienced is almost worthless. By ‘unicorn,’ this is the less common definition of the word:
“Something that is greatly desired but difficult or impossible to find.”
The pandemic profoundly changed real estate over the last few years. The demand for a home of our own skyrocketed, and people needed a home office and big backyard.
- Waves of first-time and second-home buyers entered the market.
- Already low mortgage rates were driven to historic lows.
- The forbearance plan all but eliminated foreclosures.
- Home values reached appreciation levels never seen before.
It was a market that forever had been “greatly desired but difficult or impossible to find.” A ‘unicorn’ year.
Now, things are getting back to normal. The ‘unicorns’ have galloped off.
Comparing today’s market to those years makes no sense. Here are three examples:
Buyer Demand
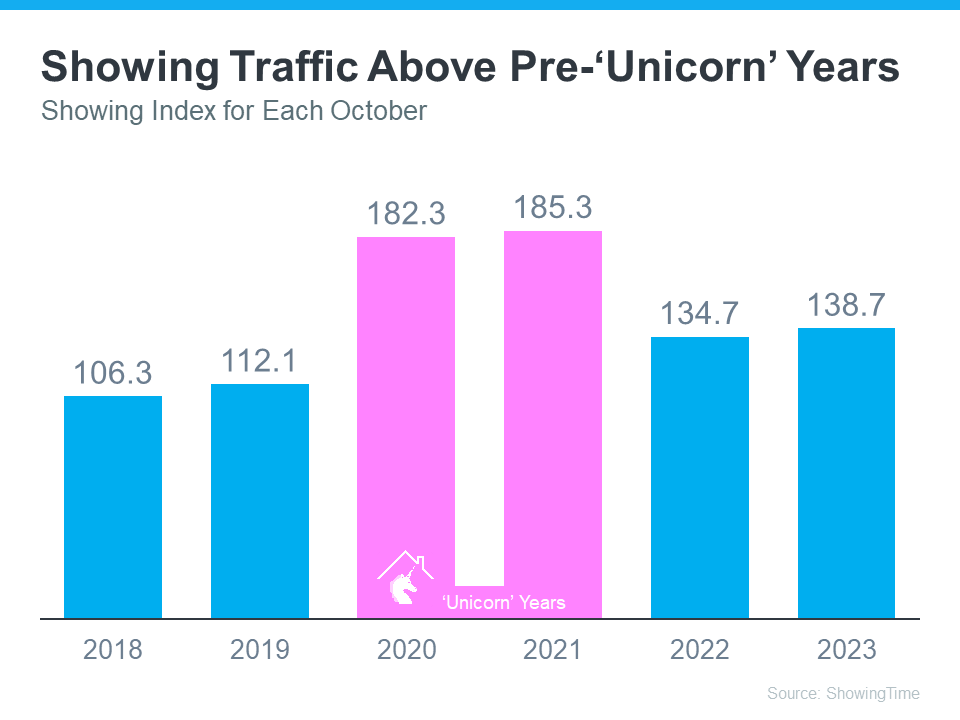
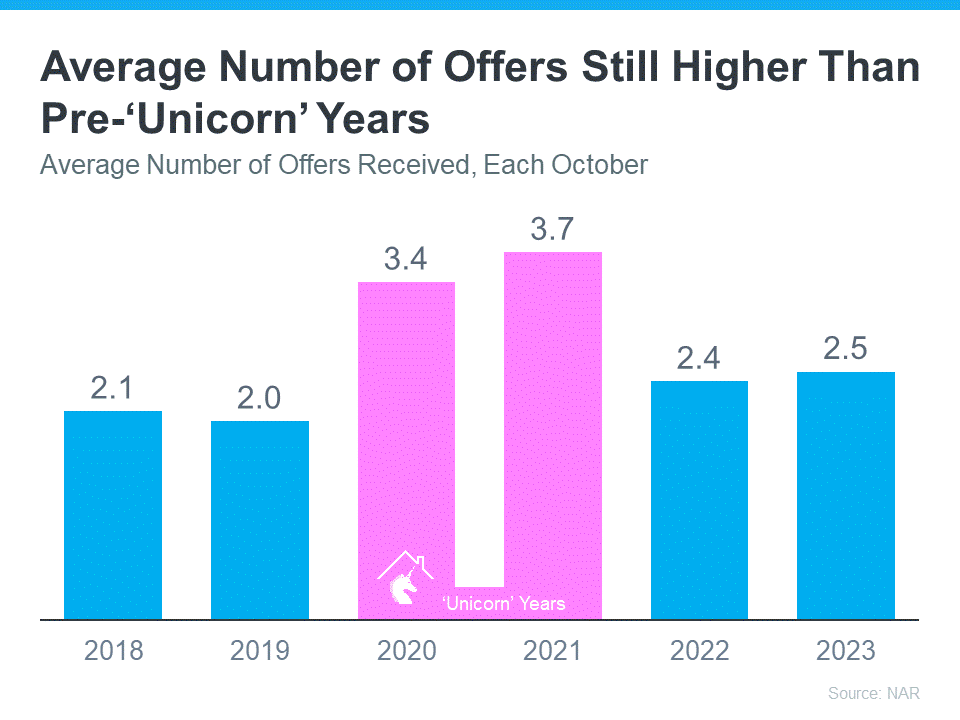
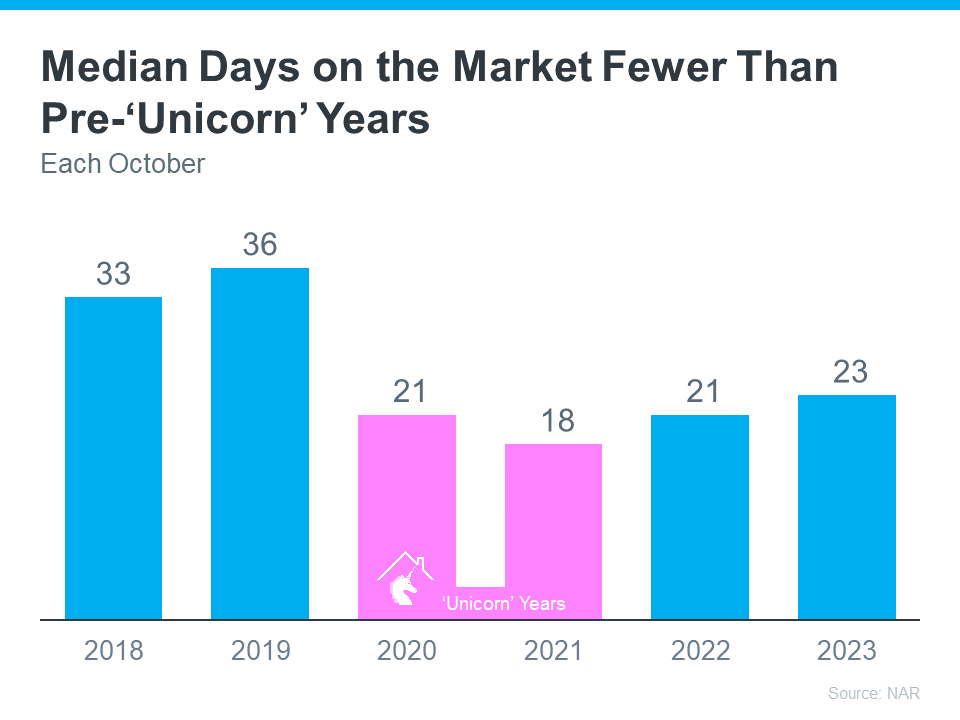
If you look at the headlines, you’d think there aren’t any buyers out there. We still sell over 10,000 houses a day in the United States. Of course, buyer demand is down from the two ‘unicorn’ years. But, according to ShowingTime, if we compare it to normal years (2017-2019), we can see that buyer activity is still strong (see graph below):
Home Prices
We can’t compare today’s home price increases to the last couple of years. According to Freddie Mac, 2020 and 2021 each had historic appreciation numbers. Here’s a graph also showing the more normal years (2017-2019):
We can see that we’re returning to more normal home value increases. There were several months of minimal depreciation in the second half of 2022. However, according to Fannie Mae, the market has returned to more normal appreciation in the first quarter of this year.
Foreclosures
There have already been some startling headlines about the percentage increases in foreclosure filings. Of course, the percentages will be up. They are increases over historically low foreclosure rates. Here’s a graph with information from ATTOM, a property data provider:
There will be an increase over the numbers of the last three years now that the moratorium on foreclosures has ended. There are homeowners who lose their home to foreclosure every year, and it’s heartbreaking for those families. But, if we put the current numbers into perspective, we’ll realize that we’re actually going back to the normal filings from 2017-2019.
Bottom Line
There will be very unsettling headlines around the housing market this year. Most will come from inappropriate comparisons to the ‘unicorn’ years. Let’s connect so you have an expert on your side to help you keep everything in proper perspective.
A Recession Doesn’t Equal a Housing Crisis In Ventura, CA
Everywhere you look, people are talking about a potential recession. And if you’re planning to buy or sell a house, this may leave you wondering if your plans are still a wise move. To help ease your mind, experts are saying that if we do officially enter a recession, it’ll be mild and short. As the Federal Reserve explained in their March meeting:
“. . . the staff’s projection at the time of the March meeting included a mild recession starting later this year, with a recovery over the subsequent two years.”
While a recession may be on the horizon, it won’t be one for the housing market record books like the crash in 2008. What we have to remember is that a recession doesn’t always lead to a housing crisis.
To prove it, let’s look at the historical data of what happened in real estate during previous recessions. That way you know why you shouldn’t be afraid of what a recession could mean for the housing market today.
A Recession Doesn’t Mean Falling Home Prices
To show that home prices don’t fall every time there’s a recession, it helps to turn to historical data. As the graph below illustrates, looking at recessions going all the way back to 1980, home prices appreciated in four of the last six of them. So historically, when the economy slows down, it doesn’t mean home values will always fall.
Most people remember the housing crisis in 2008 (the larger of the two red bars in the graph above) and think another recession will be a repeat of what happened to housing then. But today’s housing market isn’t about to crash because the fundamentals of the market are different than they were in 2008. Back then, one of the big reasons why prices fell was because there was a surplus of homes for sale at the same time distressed properties flooded the market. Today, the number of homes for sale is low, so while home prices may see slight declines in some areas and slight gains in others, a crash simply isn’t in the cards.
A Recession Means Falling Mortgage Rates
What a recession really means for the housing market is falling mortgage rates. As the graph below shows, historically, each time the economy slowed down, mortgage rates decreased.
Bankrate explains mortgage rates typically fall during an economic slowdown:
“During a traditional recession, the Fed will usually lower interest rates. This creates an incentive for people to spend money and stimulate the economy. It also typically leads to more affordable mortgage rates, which leads to more opportunity for homebuyers.”
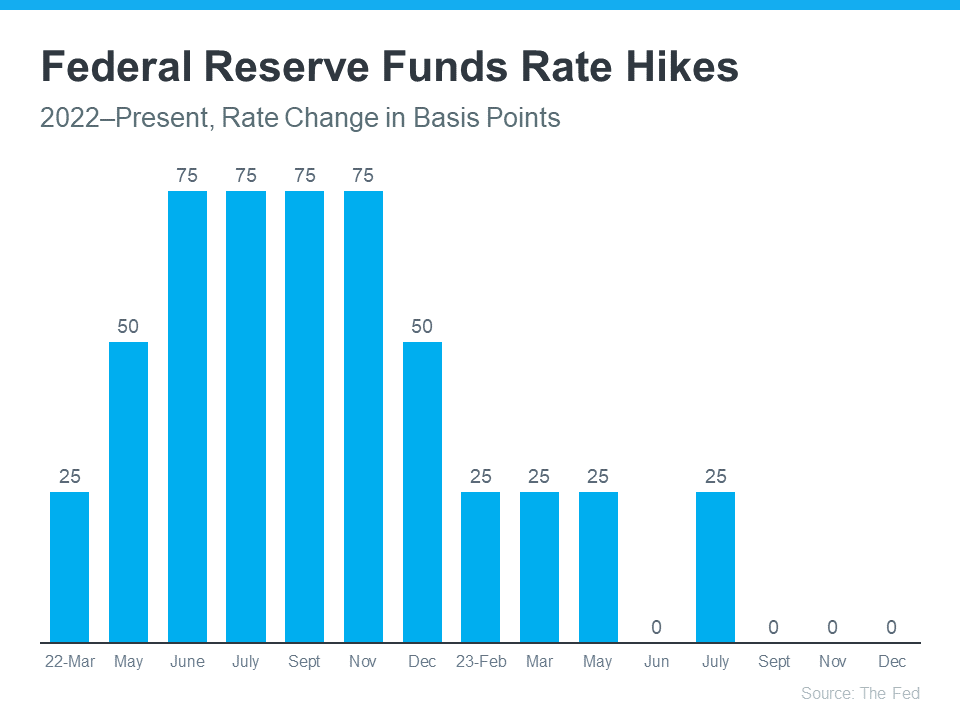
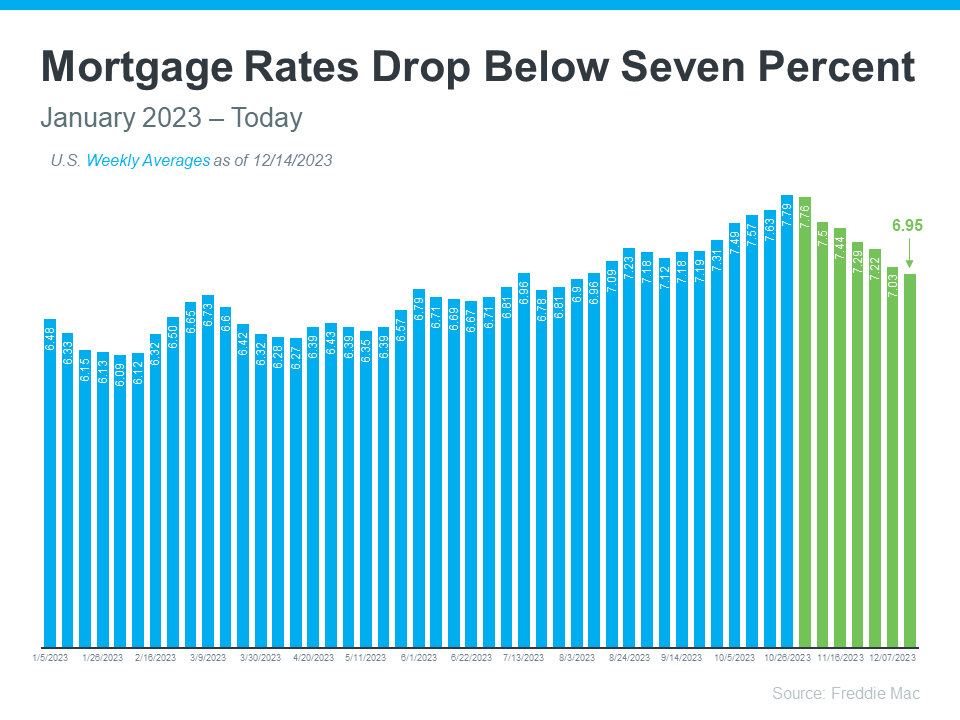
This year, mortgage rates have been quite volatile as they’ve responded to high inflation. The 30-year fixed mortgage rate has hovered between roughly 6-7%, and that’s impacted affordability for many potential homebuyers.
But, if there is a recession, history tells us mortgage rates may fall below that threshold, even though the days of 3% are behind us.
Bottom Line
You don’t need to fear what a recession means for the housing market. If we do have a recession, experts say it will be mild and short, and history shows it also means mortgage rates go down.